# Import libraries and create sample DataFrame
import pandas as pd
import matplotlib.pyplot as plt
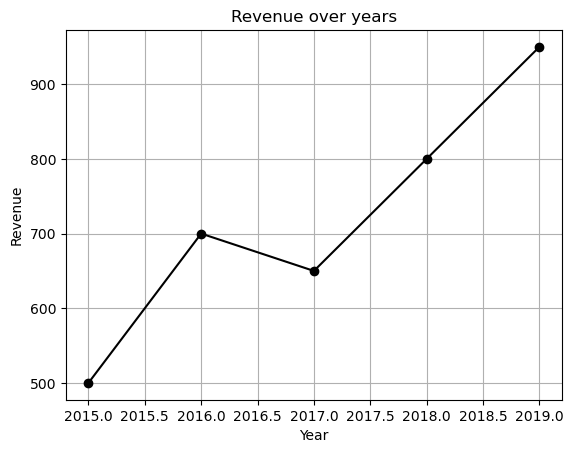
data = {
'Year': [2015,2016,2017,2018,2019],
'Revenue': [500,700,650,800,950]
}
df = pd.DataFrame(data)
df| Year | Revenue | |
|---|---|---|
| 0 | 2015 | 500 |
| 1 | 2016 | 700 |
| 2 | 2017 | 650 |
| 3 | 2018 | 800 |
| 4 | 2019 | 950 |